
How Inflammation Causes Insulin Resistance at the Cellular Level
ABSTRACT
Chronic low-grade inflammation is a central driver of insulin resistance and metabolic dysfunction. Inflammatory cytokines, including TNF-α, IL-6, and IL-1β, activate intracellular kinases (JNK, IKKβ, PKCθ) that phosphorylate insulin receptor substrate-1 (IRS-1) at serine residues, disrupting the canonical insulin signaling cascade. This serine phosphorylation inhibits the PI3K/Akt pathway, resulting in decreased GLUT4 translocation to the cell surface in skeletal muscle and increased hepatic glucose production in the liver. The resulting hyperglycemia and hyperinsulinemia create a self-reinforcing cycle that progressively worsens metabolic function. This guide presents the molecular pathway from inflammatory cytokine release to cellular insulin resistance, examines the tissue-specific consequences across skeletal muscle, liver, and adipose tissue, and outlines the clinical implications for managing metabolic patients. Understanding this mechanism is essential for identifying and addressing the inflammatory root causes of treatment resistance in metabolic disease.
TABLE OF CONTENTS
- 1. Introduction: Inflammation as the Root of Insulin Resistance
- 2. The Inflammatory Cytokine Cascade
- 3. IRS-1 Serine Phosphorylation: The Molecular Switch
- 4. PI3K/Akt Pathway Inhibition and Downstream Consequences
- 5. Tissue-Specific Metabolic Disruption
- 6. The Self-Reinforcing Cycle of Inflammation and Insulin Resistance
- 7. Clinical Implications for Metabolic Treatment
- 8. Clinical Recommendations
- 9. Conclusion
- References
- About the Author
- Intellectual Property and Disclosure
1. Introduction: Inflammation as the Root of Insulin Resistance
Insulin resistance is the hallmark of metabolic syndrome, type 2 diabetes, and obesity-related disease. While insulin resistance has traditionally been understood through the lens of caloric excess and sedentary behavior, the past two decades of molecular research have revealed a deeper mechanistic truth: chronic low-grade inflammation is the primary cellular driver of insulin resistance.
Excess adiposity, particularly visceral fat accumulation, creates a pro-inflammatory microenvironment. Enlarged adipocytes recruit macrophages and other immune cells, which release a cascade of inflammatory cytokines including tumor necrosis factor-alpha (TNF-α), interleukin-6 (IL-6), and interleukin-1 beta (IL-1β). These cytokines do not merely accompany metabolic dysfunction; they directly cause it by disrupting the insulin signaling pathway at the molecular level.
This guide presents the step-by-step molecular mechanism through which inflammatory cytokines cause insulin resistance at the cellular level, from cytokine release through intracellular kinase activation, IRS-1 dysfunction, PI3K/Akt pathway inhibition, and ultimately impaired glucose uptake and metabolic dysregulation.
Understanding this pathway is not merely academic. It has direct clinical implications: patients with high baseline inflammation will show reduced responsiveness to metabolic therapies. Addressing inflammation is therefore not optional but essential for achieving durable metabolic outcomes.
2. The Inflammatory Cytokine Cascade
The inflammatory cascade that drives insulin resistance begins in adipose tissue and extends systemically. Understanding the origin and behavior of key inflammatory mediators is essential for comprehending how cellular insulin signaling is disrupted.
2.1 Sources of Inflammatory Cytokines
The primary sources of metabolic inflammation include:
- Visceral adipose tissue: Enlarged, hypertrophic adipocytes become hypoxic and stressed, releasing pro-inflammatory signals that recruit immune cells
- Adipose tissue macrophages: Crown-like structures form around dying adipocytes, with M1-polarized macrophages producing sustained cytokine output
- Hepatic Kupffer cells: Liver-resident macrophages activated by circulating lipopolysaccharide (LPS) and free fatty acids
- Gut-derived endotoxemia: Bacterial LPS translocating through a compromised intestinal barrier activates systemic immune responses
2.2 Key Inflammatory Cytokines
Three cytokines play central roles in the inflammatory disruption of insulin signaling:
- TNF-α (Tumor Necrosis Factor-alpha): The first cytokine demonstrated to directly cause insulin resistance. TNF-α activates JNK and IKKβ kinases, which phosphorylate IRS-1 at inhibitory serine residues. TNF-α also promotes lipolysis in adipose tissue, increasing circulating free fatty acids that further impair insulin signaling
- IL-6 (Interleukin-6): Produced in large quantities by visceral adipose tissue. IL-6 activates the JAK/STAT pathway and induces SOCS3 (suppressor of cytokine signaling 3), which directly binds to and inhibits the insulin receptor and IRS-1. IL-6 also promotes hepatic CRP production, amplifying the systemic inflammatory state
- IL-1β (Interleukin-1 beta): Activates NF-κB signaling and promotes pancreatic beta-cell dysfunction. IL-1β impairs insulin secretion while simultaneously worsening peripheral insulin resistance, creating a dual metabolic insult
3. IRS-1 Serine Phosphorylation: The Molecular Switch
Insulin receptor substrate-1 (IRS-1) is the critical intracellular adaptor protein that transmits the insulin signal from the insulin receptor to downstream metabolic effectors. The phosphorylation state of IRS-1 determines whether the insulin signal proceeds or is blocked.
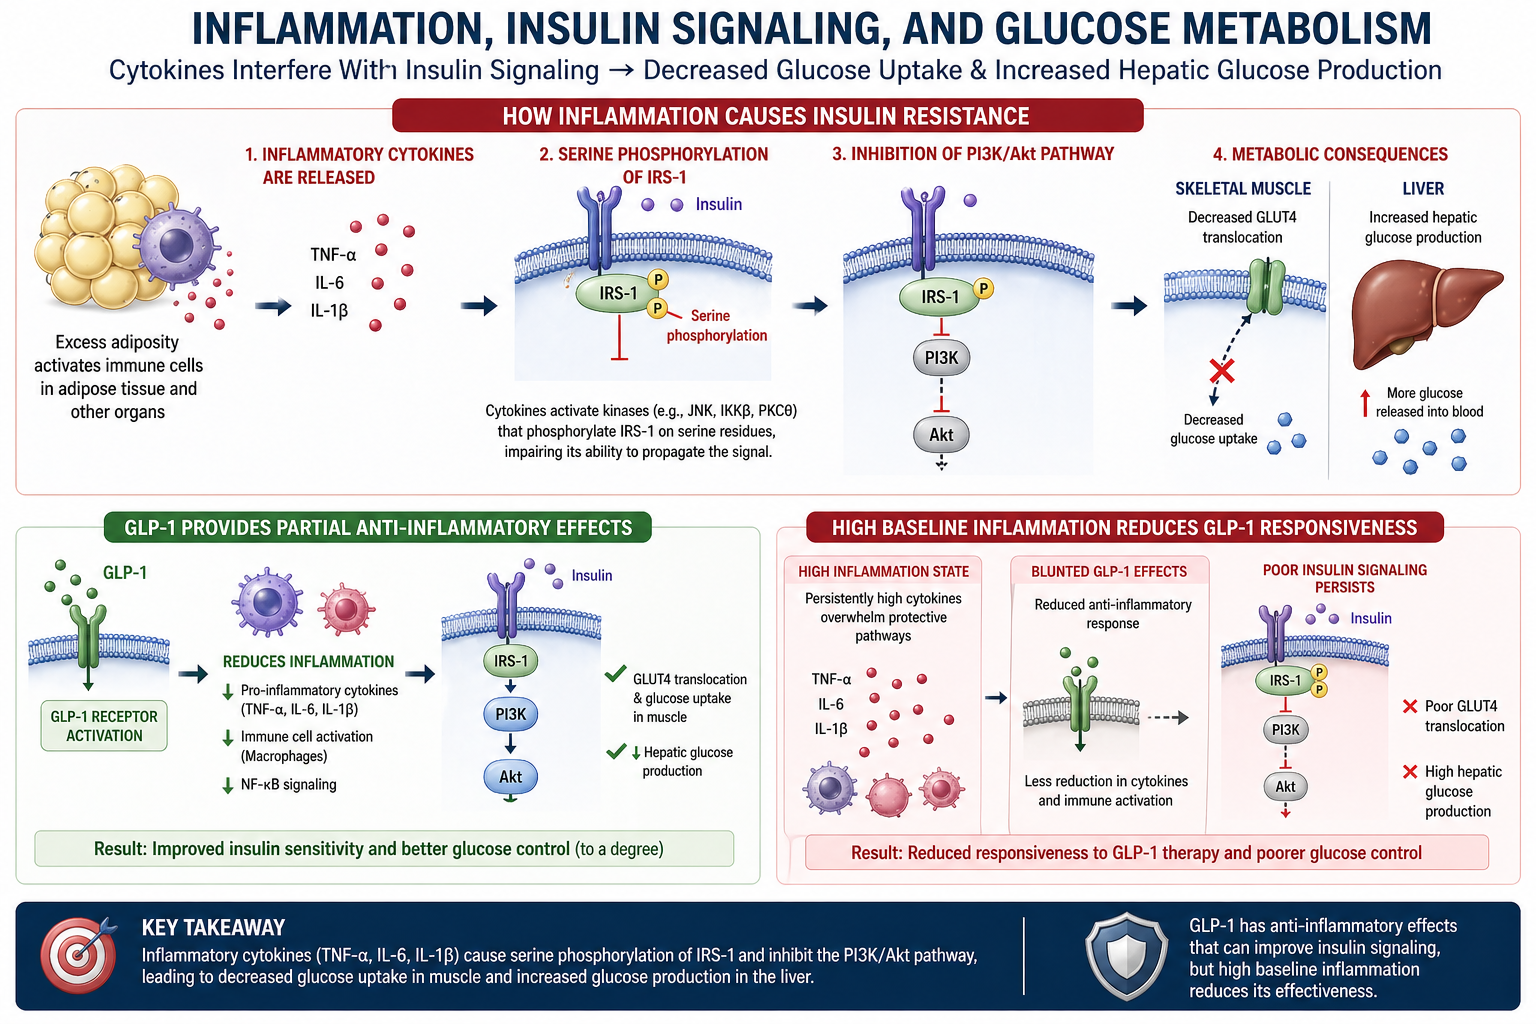
© 2026 Dr. Haad Mahmood, MD. All rights reserved. Original intellectual property. Reproduction prohibited without written permission.
Mahmood H. Inflammation, Insulin Signaling, and Glucose Metabolism. HaadMD. 2026. https://haadmd.com
3.1 Normal Insulin Signaling: Tyrosine Phosphorylation
Under normal conditions, insulin binds to the insulin receptor on the cell surface, activating its intrinsic tyrosine kinase activity. The receptor then phosphorylates IRS-1 at specific tyrosine residues. This tyrosine phosphorylation is the "green light" that allows IRS-1 to bind and activate phosphoinositide 3-kinase (PI3K), initiating the downstream signaling cascade that ultimately results in glucose uptake.
3.2 Inflammatory Disruption: Serine Phosphorylation
Inflammatory cytokines activate three key intracellular kinases that phosphorylate IRS-1 at serine residues instead of tyrosine residues:
- JNK (c-Jun N-terminal kinase): Activated by TNF-α and cellular stress. JNK phosphorylates IRS-1 at serine 307, which directly blocks the ability of the insulin receptor to phosphorylate IRS-1 at tyrosine residues
- IKKβ (inhibitor of nuclear factor kappa-B kinase subunit beta): Activated by TNF-α and IL-1β. IKKβ phosphorylates IRS-1 at serine 312 and also activates NF-κB, which further amplifies inflammatory cytokine production
- PKCθ (protein kinase C theta): Activated by diacylglycerol (DAG) accumulation from excess lipid metabolism. PKCθ phosphorylates IRS-1 at multiple serine residues, particularly in skeletal muscle
Serine phosphorylation of IRS-1 functions as a molecular "off switch" for insulin signaling. When IRS-1 is phosphorylated at serine residues, it can no longer be effectively phosphorylated at tyrosine residues by the insulin receptor. The insulin signal is effectively blocked at the first intracellular step.
4. PI3K/Akt Pathway Inhibition and Downstream Consequences
When IRS-1 is rendered dysfunctional by serine phosphorylation, the entire downstream insulin signaling cascade is disrupted. The PI3K/Akt pathway is the primary metabolic signaling arm of insulin action, and its inhibition produces the cardinal features of insulin resistance.
4.1 The PI3K/Akt Signaling Cascade
In normal insulin signaling, the pathway proceeds as follows:
- IRS-1 (tyrosine-phosphorylated) binds and activates PI3K (phosphoinositide 3-kinase)
- PI3K converts PIP2 to PIP3 at the cell membrane
- PIP3 recruits and activates Akt (also known as protein kinase B)
- Activated Akt phosphorylates multiple downstream targets that promote glucose uptake, glycogen synthesis, protein synthesis, and cell survival
When inflammatory serine phosphorylation blocks IRS-1 function, PI3K is not activated, PIP3 is not generated, and Akt remains inactive. The entire metabolic program of insulin is shut down.
4.2 GLUT4 Translocation Failure
The most clinically significant consequence of PI3K/Akt inhibition is the failure of GLUT4 translocation in skeletal muscle and adipose tissue:
- GLUT4 is the primary insulin-responsive glucose transporter
- Under normal conditions, Akt activation triggers GLUT4 vesicles to translocate from intracellular storage compartments to the cell surface membrane
- When GLUT4 inserts into the membrane, it creates channels for glucose to enter the cell
- When Akt is inactive due to inflammatory IRS-1 dysfunction, GLUT4 remains sequestered inside the cell
- Glucose cannot enter the cell despite adequate circulating insulin, resulting in hyperglycemia
Skeletal muscle accounts for approximately 80% of insulin-stimulated glucose disposal. When GLUT4 translocation fails in muscle tissue, the body loses its primary mechanism for clearing glucose from the bloodstream.
4.3 Hepatic Glucose Production
In the liver, insulin normally suppresses gluconeogenesis (the production of new glucose from non-carbohydrate precursors). When hepatic insulin signaling is impaired by inflammation:
- The liver continues to produce glucose even when blood glucose is already elevated
- Glycogen synthesis is reduced, further contributing to hyperglycemia
- Lipogenesis is paradoxically maintained (through alternative signaling pathways), leading to hepatic fat accumulation and non-alcoholic fatty liver disease (NAFLD)
5. Tissue-Specific Metabolic Disruption
Inflammation-driven insulin resistance manifests differently across the body's major metabolic tissues. Each tissue contributes uniquely to the overall metabolic dysfunction.
5.1 Skeletal Muscle
- Decreased GLUT4 translocation reduces glucose uptake by up to 50-70% in severely insulin-resistant states
- Impaired glycogen synthesis limits the muscle's capacity to store glucose for future energy needs
- Reduced protein synthesis and increased proteolysis contribute to sarcopenia, further worsening metabolic capacity
- Decreased insulin signaling reduces the IRS-1/PI3K/Akt pathway activation that normally follows exercise
5.2 Liver
- Unsuppressed hepatic glucose production (gluconeogenesis) contributes significantly to fasting and postprandial hyperglycemia
- Increased de novo lipogenesis drives hepatic fat accumulation (NAFLD/NASH)
- Elevated VLDL production increases circulating triglycerides and atherogenic lipid particles
- Impaired glycogen storage reduces the liver's buffering capacity for glucose homeostasis
5.3 Adipose Tissue
- Increased lipolysis releases free fatty acids into the circulation, providing substrate for hepatic lipogenesis and further activating inflammatory pathways
- Inflammation within adipose tissue ("crown-like structures" of macrophages surrounding dying adipocytes) creates a sustained source of TNF-α, IL-6, and MCP-1
- Adipokine dysregulation: decreased adiponectin (anti-inflammatory, insulin-sensitizing) and increased leptin (pro-inflammatory in excess)
- Impaired adipogenesis forces lipid storage into ectopic sites (liver, muscle, pancreas)
5.4 Brain (Hypothalamic Inflammation)
- Inflammatory cytokines cross the blood-brain barrier and induce hypothalamic inflammation
- Leptin resistance develops: the brain becomes unable to accurately sense satiety signals
- Apposite dysregulation drives increased caloric intake, further perpetuating the cycle
- Central insulin resistance impairs the brain's role in hepatic glucose output regulation
6. The Self-Reinforcing Cycle of Inflammation and Insulin Resistance
One of the most clinically important aspects of inflammation-driven insulin resistance is its selfperpetuating nature. The cycle operates through multiple feedback loops:
- Inflammation causes insulin resistance through the IRS-1 serine phosphorylation mechanism described above
- Insulin resistance leads to hyperinsulinemia (compensatory insulin overproduction by the pancreas)
- Hyperinsulinemia promotes further adipose tissue expansion, particularly visceral fat
- Expanded visceral adipose tissue produces more inflammatory cytokines
- Increased cytokines cause further IRS-1 dysfunction, worsening insulin resistance
- Hyperglycemia itself generates advanced glycation end products (AGEs) and reactive oxygen species (ROS), both of which activate NF-κB and amplify inflammation
This cycle explains why metabolic dysfunction tends to worsen progressively over time without intervention. It also explains why single-target pharmacologic approaches often produce limited results: interrupting one node of the cycle does not eliminate the self-reinforcing feedback from the remaining nodes.
7. Clinical Implications for Metabolic Treatment
The molecular understanding of inflammation-driven insulin resistance has profound implications for clinical metabolic management.
7.1 High Baseline Inflammation Reduces Treatment Responsiveness
Patients with elevated inflammatory markers (hs-CRP, IL-6, TNF-α, ferritin) at treatment initiation will demonstrate:
- Reduced insulin sensitivity improvements from pharmacologic intervention
- Blunted appetite suppression from satiety-targeting therapies
- Slower and more limited weight loss
- Higher rates of treatment plateau and weight regain
- Increased risk of lean body mass loss relative to fat mass loss
7.2 Inflammatory Biomarkers to Monitor
Clinicians managing metabolic patients should assess inflammatory burden at baseline and longitudinally:
- hs-CRP (high-sensitivity C-reactive protein): The most widely available and validated marker of systemic inflammation. Levels above 3.0 mg/L indicate significant inflammatory burden
- IL-6: A direct mediator of insulin resistance through SOCS3 induction. More specific than CRP for metabolic inflammation
- TNF-α: The primary activator of JNK and IKKβ kinases responsible for IRS-1 serine phosphorylation
- Fasting insulin and HOMA-IR: Direct measures of insulin resistance severity. HOMA-IR above 2.5 indicates clinically significant insulin resistance
- Ferritin: When elevated in the context of normal iron studies, ferritin functions as an acute-phase reactant indicating chronic inflammation
7.3 Anti-Inflammatory Strategies
Evidence-based approaches to reduce metabolic inflammation include:
- Dietary modification: Mediterranean-pattern eating with emphasis on omega-3 fatty acids, polyphenols, and fiber. Elimination of ultra-processed foods, refined sugars, and industrial seed oils
- Targeted supplementation: Omega-3 fatty acids (EPA/DHA at therapeutic doses), curcumin, resveratrol, and vitamin D
- Exercise: Both resistance and aerobic exercise reduce systemic inflammation through myokine release (particularly IL-10 and IL-1ra) and improved metabolic flux
- Gut barrier restoration: Addressing intestinal permeability reduces LPS-driven systemic inflammation (see companion publication on gut leakiness)
- Stress management: Cortisol-mediated inflammation amplification can be reduced through HPA axis regulation (see companion publication on cortisol dysfunction)
8. Clinical Recommendations
- Assess inflammatory burden at baseline in all metabolic patients. Order hs-CRP, fasting insulin, HOMA-IR, and consider IL-6 and TNF-α in patients with suspected high inflammatory load.
- Recognize that insulin resistance is an inflammatory disease. The molecular mechanism is clear: cytokines activate kinases that phosphorylate IRS-1 at serine residues, blocking the insulin signal. Treatment must address this root cause.
- Implement anti-inflammatory dietary interventions as first-line therapy. Mediterranean-pattern eating, omega-3 supplementation, elimination of ultra-processed foods and refined sugars. These are not adjuncts; they are foundational.
- Monitor inflammatory markers longitudinally. Track hs-CRP and fasting insulin at baseline and every 3 to 6 months. Decreasing inflammation predicts improving metabolic outcomes.
- Address all sources of inflammatory input. Gut barrier dysfunction, visceral adiposity, chronic stress, sleep disruption, and environmental toxins all feed the inflammatory cascade. Multi-modal intervention is required.
- Do not escalate pharmacologic therapy without addressing inflammation. Increasing medication dose in the presence of active, unaddressed inflammation will produce diminishing returns. The cellular machinery for treatment response is impaired at the IRS-1 level.
- Use exercise as an anti-inflammatory prescription. Resistance training and moderate aerobic exercise produce anti-inflammatory myokines and improve insulin sensitivity through GLUT4 upregulation independent of the insulin signaling pathway.
9. Conclusion
The molecular pathway from inflammation to insulin resistance is now well established: inflammatory cytokines (TNF-α, IL-6, IL-1β) activate intracellular kinases (JNK, IKKβ, PKCθ) that phosphorylate IRS-1 at serine residues, blocking tyrosine phosphorylation, inhibiting PI3K/Akt activation, preventing GLUT4 translocation, and disrupting hepatic glucose regulation. The result is a cellular environment that is resistant to insulin action regardless of circulating insulin levels.
This mechanism explains why metabolic disease is progressive, why pharmacologic therapy alone often produces limited results, and why patients with high inflammatory burden show reduced treatment responsiveness. The self-reinforcing nature of the inflammation-insulin resistance cycle ensures that without direct anti-inflammatory intervention, metabolic dysfunction will continue to worsen.
The clinical imperative is clear: inflammation assessment and management must be integrated into every metabolic treatment plan. Anti-inflammatory dietary modification, targeted supplementation, exercise, gut barrier restoration, and stress management are not optional lifestyle recommendations. They are essential therapeutic interventions that address the molecular root cause of insulin resistance.
It is a failure of the cell to receive the signal.
Fix the inflammation, and the signal gets through."
~ Dr. Haad Mahmood, MD
References
- Mahmood H. Inflammation, Insulin Signaling, and Glucose Metabolism [Figure 1]. Correlating GLP-1 Outcomes with Advanced Lab Panels: Cytokines, Metabolic Markers, and Hormones. 2026. Original intellectual property of Dr. Haad Mahmood, MD.
- Mahmood H. The Physician's Definitive Guide to Maximizing GLP-1 Outcomes: The 80/20 Framework. HaadMD Clinical Reference Series. April 2026.
- Hotamisligil GS. Inflammation and metabolic disorders. Nature. 2006;444(7121):860-867.
- Shoelson SE, Lee J, Goldfine AB. Inflammation and insulin resistance. J Clin Invest. 2006;116(7):1793-1801.
- Aguirre V, Uchida T, Yenush L, Davis R, White MF. The c-Jun NH(2)-terminal kinase promotes insulin resistance during association with insulin receptor substrate-1 and phosphorylation of Ser(307). J Biol Chem. 2000;275(12):9047-9054.
- Hirosumi J, Tuncman G, Chang L, et al. A central role for JNK in obesity and insulin resistance. Nature. 2002;420(6913):333-336.
- Cai D, Yuan M, Frantz DF, et al. Local and systemic insulin resistance resulting from hepatic activation of IKK-beta and NF-kappaB. Nat Med. 2005;11(2):183-190.
- Senn JJ, Klover PJ, Nowak IA, et al. Suppressor of cytokine signaling-3 (SOCS-3), a potential mediator of interleukin-6-dependent insulin resistance in hepatocytes. J Biol Chem. 2003;278(16):13740-13746.
- Pedersen BK, Febbraio MA. Muscles, exercise and obesity: skeletal muscle as a secretory organ. Nat Rev Endocrinol. 2012;8(8):457-465.
- Wellen KE, Hotamisligil GS. Inflammation, stress, and diabetes. J Clin Invest. 2005;115(5):1111-1119.
- DeFronzo RA. Pathogenesis of type 2 diabetes mellitus. Med Clin North Am. 2004;88(4):787-835.
- Samuel VT, Shulman GI. Mechanisms for insulin resistance: common threads and missing links. Cell. 2012;148(5):852-871.